
Keyword
ROI:006
24 record(s)
Type of resources
Available actions
Topics
Keywords
Contact for the resource
Provided by
Years
Formats
Representation types
Update frequencies
Status
-

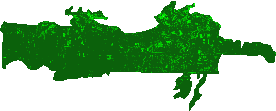
Brightness Index: This index is representing the average of the brightness of a satellite image. The Brightness Index algorithm is representing the average of the brightness of a satellite image. The result looks like a panchromatic image with the same resolution of the original image.This index is therefore sensitive to the brightness of soils which is highly correlated with the humidity and the presence of salts in surface (Escadafal 1989). The BI results from the following equation: BI = sqrt( ( (red_factor * red * red_factor * red) + (green_factor * green * green_factor * green) ) / 2 )
-

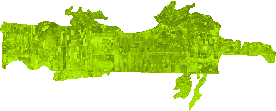
The Normalized Difference Water Index algorithm was developed by Gao (19964) being a measure of liquid water molecules in vegetation canopies that interacted with the incoming solar radiation. NDWI is sensitive to changes in liquid water content of vegetation canopies. It is less sensitive to atmospheric effects than NDVI. NDWI does not remove completely the background soil reflectance effects therefore it should be considered as an independent vegetation index. It is complementary to not a substitute for NDVI. The NDWI results from the following equation: NDWI = (IR_factor * near_IR - mir_factor * middle_IR) / (IR_factor * near_IR + mir_factor * middle_IR)
-
The Redness Index algorithm was developed to identify soil colour variations - Pouget et al.(1990). The RI results from the following equation: RI = (red_factor * red * red_factor * red) / (green_factor * green * green_factor * green * green_factor * green)
-

The Pigment Specific Simple Ratio (chlorophyll index) algorithm was developed by Blackburn (1998). It investigates the potential of a range of spectral approaches for quantifying pigments at the scale of the whole plant canopy. When applying existing narrow-band pigment indices the PSSR algorithms have the strongest and most linear relationships with canopy concentration per unit area of Chl a (Chlorophyll a) Chl b (Chlorophyll b) and Cars (carotenoids). The PSSRa results from the following equation: PSSRa = (IR_factor * near_IR) / (red_factor * red)
-

The Transformed Normalized Difference Vegetation Index algorithm indicates a relation between the amount of green biomass that is found in a pixel. (Senseman et.al. 1996). Transformed Normalised Difference Vegetation index (TNDVI) is the square root of the NDVI. It has higher coefficient of determination for the same variable and this is the difference between TNDVI and NDVI. The formula of TNDVI has always positive values and the variances of the ratio are proportional to mean values. The TNDVI results from the following equation: TNDVI = sqrt( (IR_factor * near_IR - red_factor * red) / (IR_factor * near_IR + red_factor * red) + 0.5)
-

The Transformed Soil Adjusted Vegetation Index (TSAVI) method is a vegetation index that minimizes soil brightness influences by assuming the soil line has an arbitrary slope and intercept. TSAVI = (s *(NIR - s * Red - a)) / (a * NIR + Red - a * s + X * (1 + s2))
-

The Normalised Difference Turbidity Index (NDTI) quantifies the difference in reflectance between specific spectral bands which correlates with suspended sediment and turbidity levels.
-
The Normalized Burn Ratio Index (NBR) uses the NIR and SWIR bands to emphasize burned areas while mitigating illumination and atmospheric effects. NBR = (NIR - SWIR) / (NIR+ SWIR)
-

MCARI gives a measure of the depth of chlorophyll absorption and is very sensitive to variations in chlorophyll concentrations as well as variations in Leaf Area Index (LAI). MCARI values are not affected by illumination conditions the background reflectance from soil and other non-photosynthetic materials observed.
-

The Weighted Difference Vegetation Index algorithm was introduced by Clevers (1988). This has a relationship to PVI similar to the relationship IPVI has to NDVI. WDVI is a mathematically simpler version of PVI but it has an unrestricted range.Like PVI WDVI is very sensitive to atmospheric variations (Qi et al. 1994). The WDVI results from the following equation: WDVI = (IR_factor * near_IR - g * red_factor * red) where: g is the slope of the soil line.