
Keyword
Cloud Cover: 53%
24 record(s)
Type of resources
Available actions
Topics
Keywords
Contact for the resource
Provided by
Years
Formats
Representation types
Update frequencies
Status
-

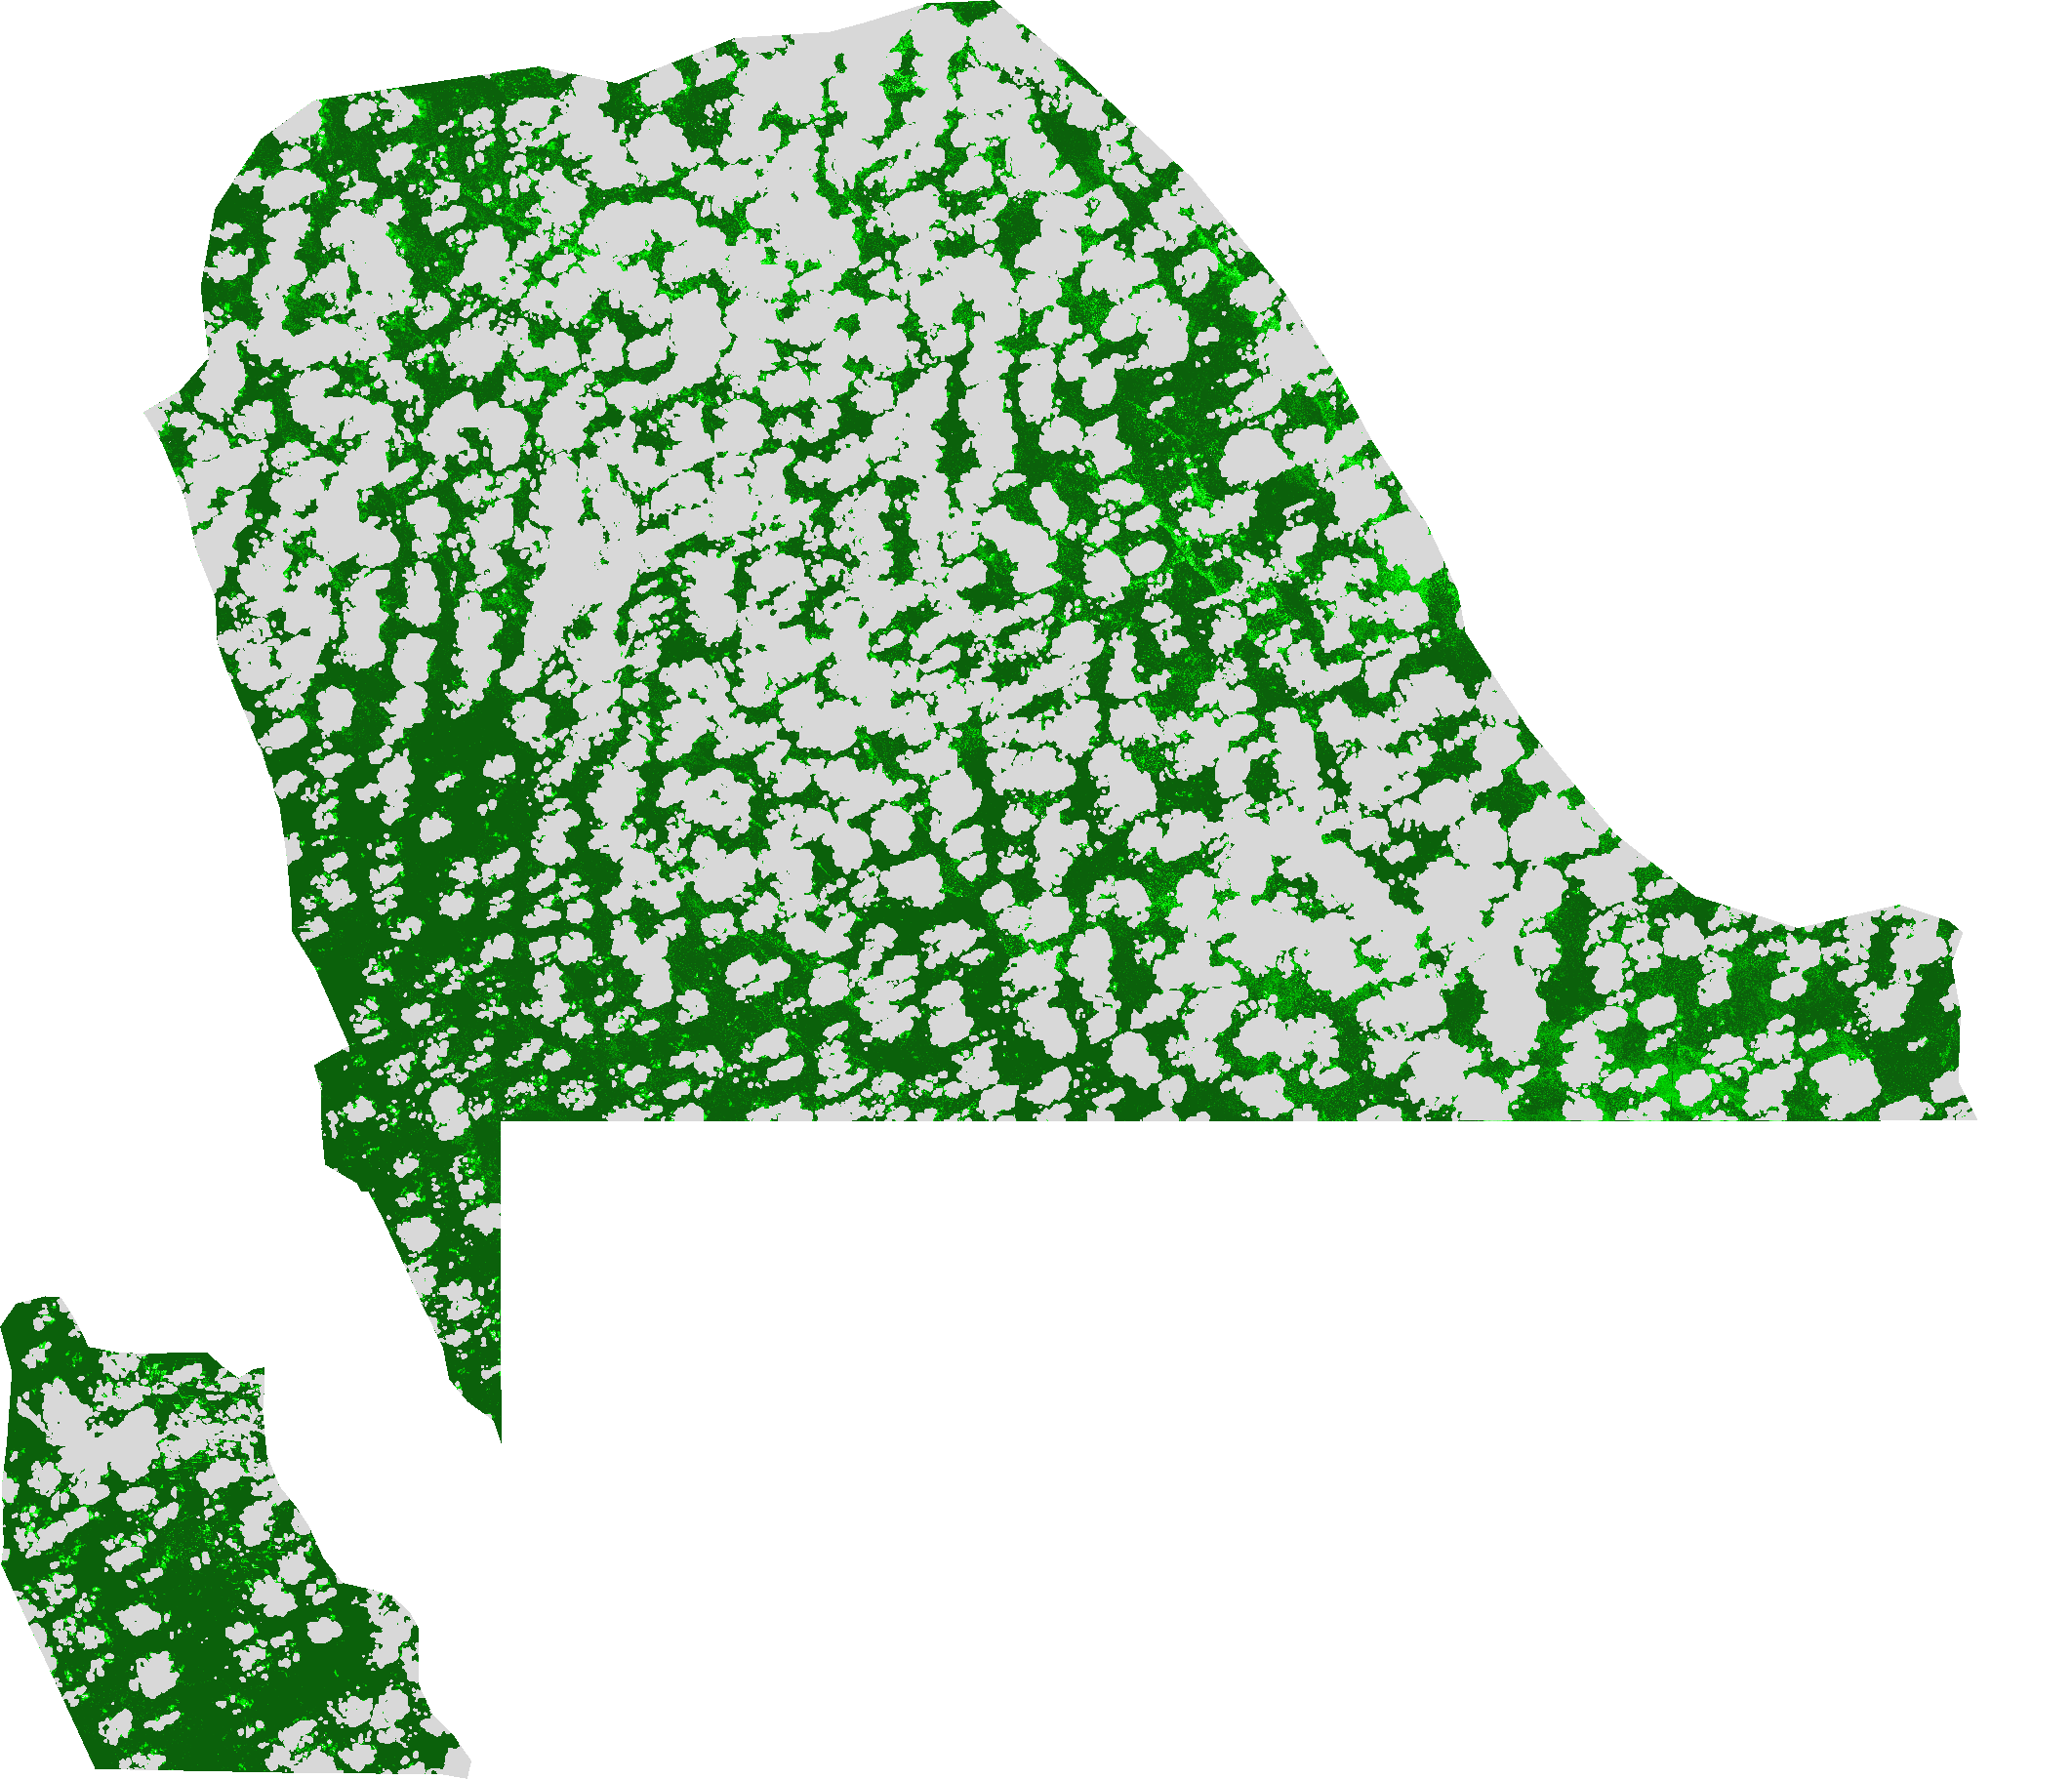
Difference Vegetation Index: This index is sensitive to the amount of vegetation. The Difference Vegetation Index algorithm is sensitive to the amount of vegetation. This is the simplest vegetation index: - Sensitive to the amount of vegetation - Distinguishes between soil and vegetation - Does NOT deal with the difference between reflectance and radiance caused by the atmosphere or shadows. The DVI results from the following equation: DVI = (IR_factor * near_IR - red_factor * red). In the area of red the incoming solar radiation won't be extensively absorbed by the pigments of the mesophyll inside the folios primarily by the chlorophyll. In the area of the near infrared in contrast the bigger part of the incoming radiation was reflected.
-

Colour Index: The Colour Index algorithm was developed to differentiate soils in the field. Low valued CIs have been shown to be correlated with the presence of a high concentration of carbonates or sulfates and higher values to be correlated with crusted soils and sands in arid regions (Escadfal 1989). In most cases the CI gives complementary information with the BI and the NDVI. Used for diachronic analyses they help for a better understanding of the evolution of soil surfaces. The CI results from the following equation: CI = (red_factor * red - green_factor * green) / (red_factor * red + green_factor * green)
-

Brightness Index: This index is representing the average of the brightness of a satellite image. The Brightness Index algorithm is representing the average of the brightness of a satellite image. The result looks like a panchromatic image with the same resolution of the original image.This index is therefore sensitive to the brightness of soils which is highly correlated with the humidity and the presence of salts in surface (Escadafal 1989). The BI results from the following equation: BI = sqrt( ( (red_factor * red * red_factor * red) + (green_factor * green * green_factor * green) ) / 2 )
-

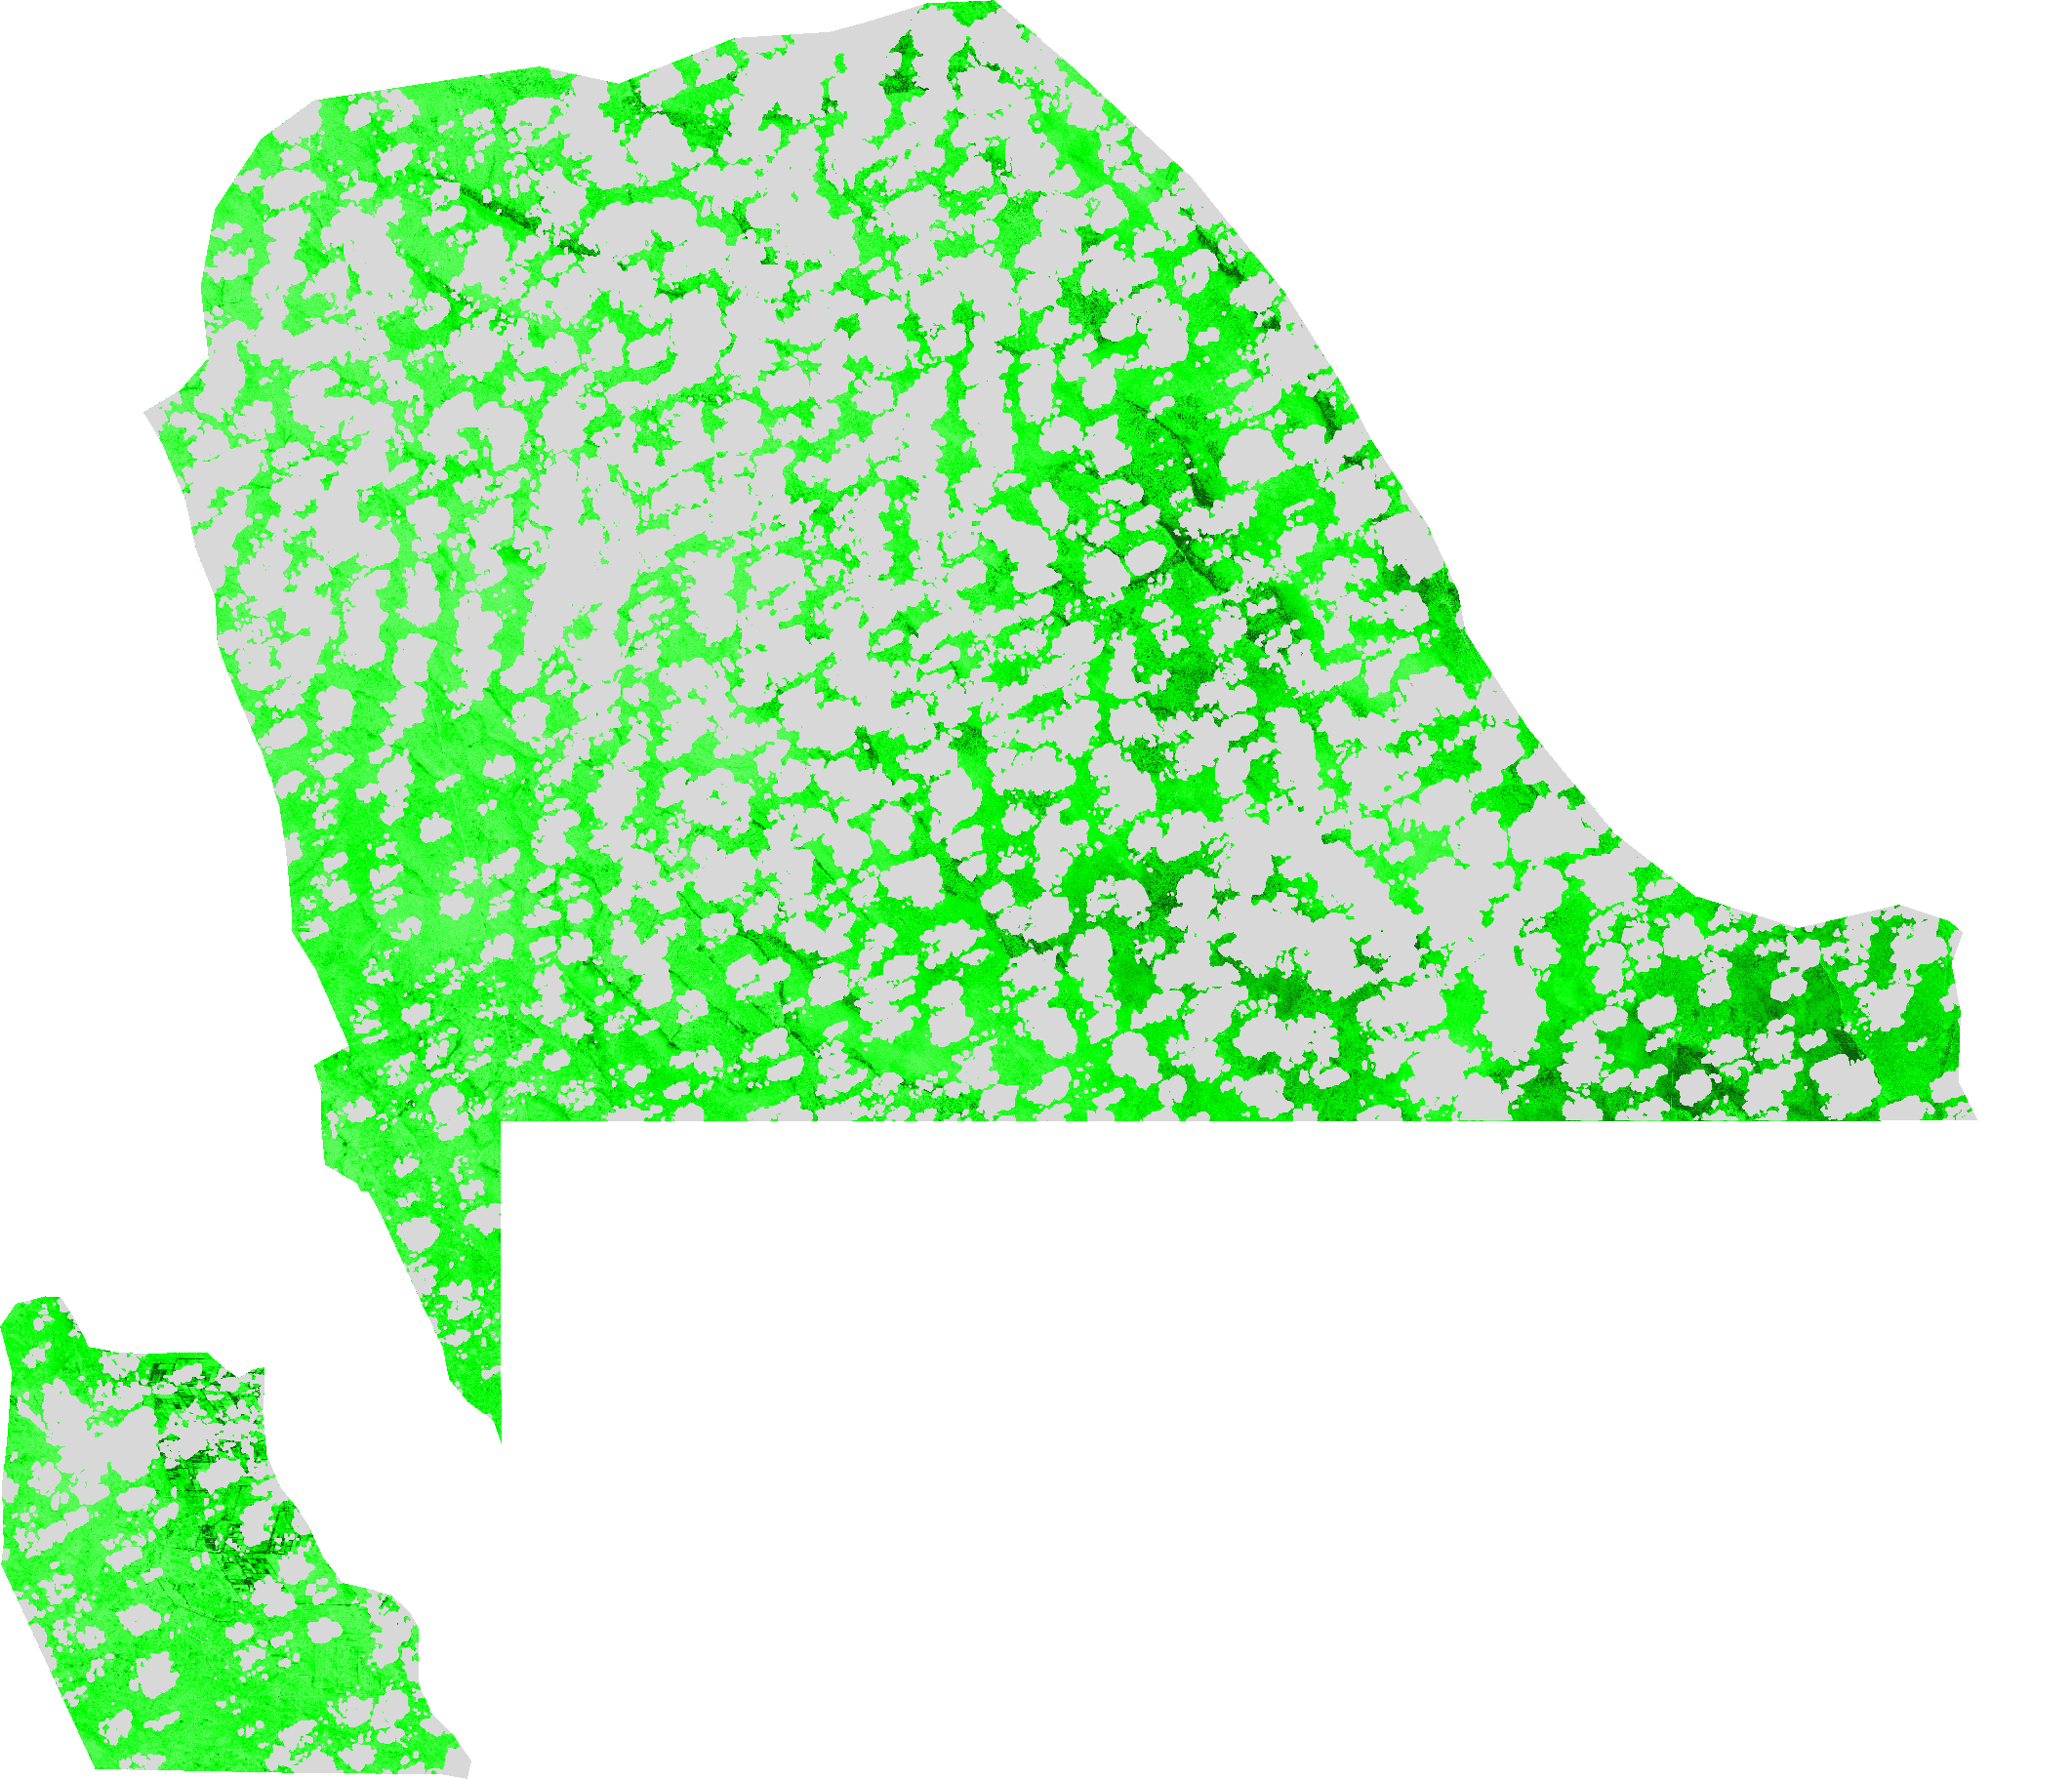
The Transformed Normalized Difference Vegetation Index algorithm indicates a relation between the amount of green biomass that is found in a pixel. (Senseman et.al. 1996). Transformed Normalised Difference Vegetation index (TNDVI) is the square root of the NDVI. It has higher coefficient of determination for the same variable and this is the difference between TNDVI and NDVI. The formula of TNDVI has always positive values and the variances of the ratio are proportional to mean values. The TNDVI results from the following equation: TNDVI = sqrt( (IR_factor * near_IR - red_factor * red) / (IR_factor * near_IR + red_factor * red) + 0.5)
-
The Redness Index algorithm was developed to identify soil colour variations - Pouget et al.(1990). The RI results from the following equation: RI = (red_factor * red * red_factor * red) / (green_factor * green * green_factor * green * green_factor * green)
-

The Normalized Difference Pond Index algorithm was developed by J.P Lacaux et al. (2006).The NDPI makes it possible not only to distinguish small ponds and water bodies (down to 0.01 ha) but also to differentiate vegetation inside ponds from that in their surroundings The NDPI results from the following equation: NDPI = (mir_factor * middle_IR - green_factor * green) / (mir_factor * middle_IR + green_factor * green)
-

The Normalised Difference Turbidity Index (NDTI) quantifies the difference in reflectance between specific spectral bands which correlates with suspended sediment and turbidity levels.
-

The Normalized Burn Ratio Index (NBR) uses the NIR and SWIR bands to emphasize burned areas while mitigating illumination and atmospheric effects. NBR = (NIR - SWIR) / (NIR+ SWIR)
-
The Pigment Specific Simple Ratio (chlorophyll index) algorithm was developed by Blackburn (1998). It investigates the potential of a range of spectral approaches for quantifying pigments at the scale of the whole plant canopy. When applying existing narrow-band pigment indices the PSSR algorithms have the strongest and most linear relationships with canopy concentration per unit area of Chl a (Chlorophyll a) Chl b (Chlorophyll b) and Cars (carotenoids). The PSSRa results from the following equation: PSSRa = (IR_factor * near_IR) / (red_factor * red)
-

The Red-Edge Inflection Point Index algorithm was developed for applications in biomass and nitrogen (N) uptake measurement/management in heterogeneous fields.- Guyot et al. (1988). Red edge as the inflection point of the strong red absorption to near infrared reflectance includes the information of both crop N and growth status. The reflectance around red edge is sensitive to wide range of crop chlorophyll content N content LAI and biomass (Hatfield et al. 2008 Mutanga and Skidmore 2007 Steele et al. 2008b). The REIP general formula is based on linear four-point interpolation technique and it uses four wavebands (670 700 740 and 780 nm) - Guyot and Baret (1988). The REIP results from the following (Sensor-dependent) equation: REIP = 700 + 40 * ((r670 + r780)/2 - r700) / (r740 - r700) - as general formula or: REIP = 700 + 40 * ( (red1_factor * red1 + IR_factor * near_IR)/2) - red2_factor * red2 ) / (red3_factor * red3 - red2_factor * red2) )